pytest-play

pytest-play is a codeless, generic, pluggable and extensible automation tool,
not necessarily test automation only, based on the fantastic pytest test framework
that let you define and execute YAML files containing scripts or test scenarios
through actions and assertions that can be implemented and managed even by non technical users:
automation (not necessarily test automation). You can build a set of actions on a single file (e.g, call a JSON based API endpoint, perform an action if a condition matches) or a test automation project with many test scenarios.
For example you can create always fresh test data on demand supporting manual testing activities, build a live simulator and so on
codeless, or better almost codeless. If you have to write assertions against action results or some conditional expressions you need a very basic knowledge of Python or Javascript expressions with a smooth learning curve (something like
variables['foo'] == 'bar')generic. It is not yet again another automation tool for browser automation only, API only, etc. You can drive a browser, perform some API calls, make database queries and/or make assertions using the same tool for different technologies
So there are several free or not free testing frameworks or automation tools and many times they address just one single area testing needs and they are not extensible: API testing only, UI testing only and so on. It could be fine if you are testing a web only application like a CMS but if you are dealing with a reactive IoT application you might something more, make cross actions or cross checks against different systems or build something of more complex upon
pytest-playpowerful. It is not yet again another test automation tool, it only extends the pytest framework with another paradigm and inherits a lot of good stuff (test data decoupled by test implementation that let you write once and executed many times the same scenario thanks to native parametrization support, reporting, integration with test management tools, many useful command line options, browsers and remote Selenium grids integration, etc)
pluggable and extensible. Let’s say you need to interact with a system not yet supported by a
pytest-playplugin, you can write by your own or pay someone for you. In addition there is a scaffolding tool that let you implement your own command: https://github.com/davidemoro/cookiecutter-play-plugineasy to use. Why YAML? Easy to read, easy to write, simple and standard syntax, easy to be validated and no parentheses hell. Despite there are no recording tools (not yet) for browser interaction or API calls, the documentation based on very common patterns let you copy, paste and edit command by command with no pain
free software. It’s an open source project based on the large and friendly pytest community
easy to install. The only prerequisite is Docker thanks to the
davidemoro/pytest-playDocker Hub container. Or better, with docker, no installation is required: you just need to type the following commanddocker run -i --rm -v $(pwd):/src davidemoro/pytest-playinside your project folder See https://hub.docker.com/r/davidemoro/pytest-play
See at the bottom of the page the third party plugins that extends pytest-play:
How it works
Depending on your needs and skills you can choose to use pytest-play programmatically writing some Python code or following a Python-less approach.
As said before with pytest-play you will be able to create codeless scripts or test scenarios
with no or very little Python knowledge: a file test_XXX.yml (e.g., test_something.yml,
where test_ and .yml matter) will be automatically recognized and executed without having
to touch any *.py module.
You can run a single scenario with pytest test_XXX.yml or running the entire suite filtering
by name or keyword markers.
Despite pytest-play was born with native support for JSON format, pytest-play>=2.0 versions will support
YAML only for improved usability.
Python-less (pure YAML)
Here you can see the contents of a pytest-play project without any Python files inside
containing a login scenario:
$ tree
.
├── env-ALPHA.yml    (OPTIONAL)
└── test_login.yml
and you might have some global variables in a settings file specific for a target environment:
$ cat env-ALPHA.yml
pytest-play:
  base_url: https://www.yoursite.com
The test scenario with action, assertions and optional metadata (play_selenium external plugin needed):
$ cat test_login.yml
---
markers:
  - login
test_data:
  - username: siteadmin
    password: siteadmin
  - username: editor
    password: editor
  - username: reader
    password: reader
---
- comment: visit base url
  type: get
  provider: selenium
  url: "$base_url"
- comment: click on login link
  locator:
    type: id
    value: personaltools-login
  type: clickElement
  provider: selenium
- comment: provide a username
  locator:
    type: id
    value: __ac_name
  text: "$username"
  type: setElementText
  provider: selenium
- comment: provide a password
  locator:
    type: id
    value: __ac_password
  text: "$password"
  type: setElementText
  provider: selenium
- comment: click on login submit button
  locator:
    type: css
    value: ".pattern-modal-buttons > input[name=submit]"
  type: clickElement
  provider: selenium
- comment: wait for page loaded
  locator:
    type: css
    value: ".icon-user"
  type: waitForElementVisible
  provider: selenium
The first optional YAML document contains some metadata with keywords aka markers
so you can filter tests to be executed invoking pytest with marker expressions,
decoupled test data, etc.
The same test_login.yml scenario will be executed 3 times with different
decoupled test data test_data defined inside its first optional YAML
document (the block between the 2 --- lines).
So write once and execute many times with different test data!
You can see a hello world example here:
As told before the metadata document is optional so you might have 1 or 2 documents in your YAML file. You can find more info about Metadata format.
Here you can see the same example without the metadata section for sake of completeness:
---
- comment: visit base url
  type: get
  provider: selenium
  url: "http://YOURSITE"
- comment: click on login link
  type: clickElement
  provider: selenium
  locator:
    type: id
    value: personaltools-login
- comment: provide a username
  type: setElementText
  provider: selenium
  locator:
    type: id
    value: __ac_name
  text: "YOURUSERNAME"
- comment: provide a password
  type: setElementText
  provider: selenium
  locator:
    type: id
    value: __ac_password
  text: "YOURPASSWORD"
- comment: click on login submit button
  type: clickElement
  provider: selenium
  locator:
    type: css
    value: ".pattern-modal-buttons > input[name=submit]"
- comment: wait for page loaded
  type: waitForElementVisible
  provider: selenium
  locator:
    type: css
    value: ".icon-user"
Programmatically
You can invoke pytest-play programmatically too.
You can define a test test_login.py like this:
def test_login(play):
    data = play.get_file_contents(
        'my', 'path', 'etc', 'login.yml')
    play.execute_raw(data, extra_variables={})
Or this programmatical approach might be used if you are
implementing BDD based tests using pytest-bdd.
Core commands
pytest-play provides some core commands that let you:
- write simple Python assertions, expressions and variables
- reuse steps including other test scenario scripts
- provide a default command template for some particular providers (eg: add by default HTTP authentication headers for all requests)
- a generic wait until machinery. Useful for waiting for an observable asynchronous event will complete its flow before proceeding with the following commands that depends on the previous step completion
You can write restricted Python expressions and assertions based on the RestrictedPython package.
RestrictedPython is a tool that helps to define a subset of the Python language which allows to provide a program input into a trusted environment. RestrictedPython is not a sandbox system or a secured environment, but it helps to define a trusted environment and execute untrusted code inside of it.
See:
How to reuse steps
You can split your commands and reuse them using the include command avoiding
duplication:
- provider: include
  type: include
  path: "/some-path/included-scenario.yml"
You can create a variable for the base folder where your test scripts live.
Default commands
Some commands require many verbose options you don’t want to repeat (eg: authentication headers for play_requests).
Instead of replicating all the headers information you can initialize a pytest-play with the provider name as
key and as a value the default command you want to omit (this example neets the external plugin play_selenium):
- provider: python
  type: store_variable
  name: bearer
  expression: "'BEARER'"
- provider: python
  type: store_variable
  name: play_requests
  expression: "{'parameters': {'headers': {'Authorization': '$bearer'}}}"
- provider: play_requests
  type: GET
  comment: this is an authenticated request!
  url: "$base_url"
Store variables
You can store a pytest-play variables:
- provider: python
  type: store_variable
  expression: "1+1"
  name: foo
Make a Python assertion
You can make an assertion based on a Python expression:
- provider: python
  type: assert
  expression: variables['foo'] == 2
Exec a Python expresssion
You can execute a Python expression:
- provider: python
  type: exec
  expression: "1+1"
While condition and looping
If you need to loop over a series of commands or wait something you can use
the while command. It will execute the sequence of sub commands, if any,
while the resulting expression condition is true. Assuming you have a countdown
variable containing a integer 10, the block of commands whill be executed 10 times:
---
- provider: python
  type: while
  expression: variables['countdown'] >= 0
  timeout: 2.3
  poll: 0.1
  sub_commands:
  - provider: python
    type: store_variable
    name: countdown
    expression: variables['countdown'] - 1
The while command supersedes the other legacy commands wait_until
(stops when the condition becomes true) or wait_until_not.
commands.
Conditional commands (Python)
You can skip any command evaluating a Python based skip condition like the following:
- provider: include
  type: include
  path: "/some-path/assertions.yml"
  skip_condition: variables['cassandra_assertions'] is True
How to assert commands elapsed time
The engine updates a pytest-play variable called _elapsed
for each executed command. So you can write something that:
---
- type: GET
  provider: play_requests
  url: https://api.chucknorris.io/jokes/categories
  expression: "'dev' in response.json()"
- type: assert
  provider: python
  expression: "variables['_elapsed'] > 0"
Generate a JUnit XML report
Use the --junit-xml command line option, e.g.:
--junit-xml results.xml
You’ll get for each test case errors, commands executed in system-output (do not use -s or --capture=no otherwise you won’t
see commands in system-output) and execution timing metrics (global, per test case and per single command thanks to _elapsed property tracked on every executed command shown in system-output).
Here you can see a standard results.xml file:
<?xml version="1.0" encoding="utf-8"?><testsuite errors="0" failures="0" name="pytest" skipped="0" tests="1" time="0.360"><testcase classname="test_assertion.yml" file="test_assertion.yml" name="test_assertion.yml" time="0.326"><system-out>{'expression': '1 == 1', 'provider': 'python', 'type': 'assert', '_elapsed': 0.0003077983856201172}
{'expression': '0 == 0', 'provider': 'python', 'type': 'assert', '_elapsed': 0.0002529621124267578}
</system-out></testcase></testsuite>
Generate a custom JUnit XML report with custom properties and execution times metrics
You can track execution time metrics for monitoring and measure what is important to you. For example you can track using a machine interpretable format:
- response times (e.g., how much time is needed for returning a
POSTjson payload) - time that occurs between the invocation of an API and a reactive web application update or some asynchronous data appearing on an event store
- time that occurs between a user input on browser and results updated (e.g., a live search)
- time that occurs between a login button and the page loaded an usable (e.g., how much time is needed after a browser action to click on a target button)
Track response time metric in JUnit XML report
For example, a test_categories.yml file executed with
the command line option --junit-xml report.xml (requires play_requests plugin):
test_data:
  - category: dev
  - category: movie
  - category: food
---
- type: GET
  provider: play_requests
  url: https://api.chucknorris.io/jokes/categories
  expression: "'$category' in response.json()"
- provider: metrics
  type: record_elapsed
  name: categories_time
- type: assert
  provider: python
  expression: "variables['categories_time'] < 2.5"
  comment: you can make an assertion against the categories_time
will generate an extended report.xml file with custom properties like that:
<?xml version="1.0" encoding="utf-8"?><testsuite errors="0" failures="0" name="pytest" skipped="0" tests="3" time="2.031"><testcase classname="test_categories.yml" file="test_categories.yml" name="test_categories.yml0" time="0.968"><properties><property name="categories_time" value="0.5829994678497314"/></properties><system-out>{'expression': "'dev' in response.json()", 'provider': 'play_requests', 'type': 'GET', 'url': 'https://api.chucknorris.io/jokes/categories', '_elapsed': 0.5829994678497314}
{'name': 'categories_time', 'provider': 'metrics', 'type': 'record_elapsed', '_elapsed': 3.3855438232421875e-05}
{'comment': 'you can make an assertion against the categories_time', 'expression': "variables['categories_time'] < 2.5", 'provider': 'python', 'type': 'assert', '_elapsed': 0.0006382465362548828}
</system-out></testcase><testcase classname="test_categories.yml" file="test_categories.yml" name="test_categories.yml1" time="0.481"><properties><property name="categories_time" value="0.4184422492980957"/></properties><system-out>{'expression': "'movie' in response.json()", 'provider': 'play_requests', 'type': 'GET', 'url': 'https://api.chucknorris.io/jokes/categories', '_elapsed': 0.4184422492980957}
{'name': 'categories_time', 'provider': 'metrics', 'type': 'record_elapsed', '_elapsed': 2.09808349609375e-05}
{'comment': 'you can make an assertion against the categories_time', 'expression': "variables['categories_time'] < 2.5", 'provider': 'python', 'type': 'assert', '_elapsed': 0.000553131103515625}
</system-out></testcase><testcase classname="test_categories.yml" file="test_categories.yml" name="test_categories.yml2" time="0.534"><properties><property name="categories_time" value="0.463592529296875"/></properties><system-out>{'expression': "'food' in response.json()", 'provider': 'play_requests', 'type': 'GET', 'url': 'https://api.chucknorris.io/jokes/categories', '_elapsed': 0.463592529296875}
{'name': 'categories_time', 'provider': 'metrics', 'type': 'record_elapsed', '_elapsed': 2.09808349609375e-05}
{'comment': 'you can make an assertion against the categories_time', 'expression': "variables['categories_time'] < 2.5", 'provider': 'python', 'type': 'assert', '_elapsed': 0.00054931640625}
</system-out></testcase></testsuite>
and the custom property categories_time will be tracked for each
test case execution, for example:
<properties>
    <property name="categories_time" value="0.5829994678497314"/>
</properties>
Advanced metrics in JUnit XML report
In this example we want to measures how long it takes a page to become interactive
(page responding to user interactions) and evaluate update time for a live search feature.
Let’s see the test_search.yml example (requires play_selenium):
---
- provider: selenium
  type: get
  url: https://www.plone-demo.info/
- provider: metrics
  type: record_elapsed_start
  name: load_time
- provider: selenium
  type: setElementText
  text: plone 5
  locator:
    type: id
    value: searchGadget
- provider: metrics
  type: record_elapsed_stop
  name: load_time
- provider: metrics
  type: record_elapsed_start
  name: live_search_time
- provider: selenium
  type: waitForElementVisible
  locator:
    type: css
    value: li[data-url$="https://www.plone-demo.info/front-page"]
- provider: metrics
  type: record_elapsed_stop
  name: live_search_time
If you execute this scenario with the --junit-xml results.xml
option you’ll get a results.xml file similar to this one:
<?xml version="1.0" encoding="utf-8"?><testsuite errors="0" failures="0" name="pytest" skipped="0" tests="1" time="13.650"><testcase classname="test_search.yml" file="test_search.yml" name="test_search.yml" time="13.580"><properties><property name="load_time" value="1.1175920963287354"/><property name="live_search_time" value="1.0871295928955078"/></properties><system-out>{'provider': 'selenium', 'type': 'get', 'url': 'https://www.plone-demo.info/', '_elapsed': 9.593282461166382}
{'name': 'load_time', 'provider': 'metrics', 'type': 'record_elapsed_start', '_elapsed': 1.1682510375976562e-05}
{'locator': {'type': 'id', 'value': 'searchGadget'}, 'provider': 'selenium', 'text': 'plone 5', 'type': 'setElementText', '_elapsed': 1.1019845008850098}
{'name': 'load_time', 'provider': 'metrics', 'type': 'record_elapsed_stop', '_elapsed': 1.9788742065429688e-05}
{'name': 'live_search_time', 'provider': 'metrics', 'type': 'record_elapsed_start', '_elapsed': 1.0013580322265625e-05}
{'locator': {'type': 'css', 'value': 'li[data-url$="https://www.plone-demo.info/front-page"]'}, 'provider': 'selenium', 'type': 'waitForElementVisible', '_elapsed': 1.060795545578003}
{'name': 'live_search_time', 'provider': 'metrics', 'type': 'record_elapsed_stop', '_elapsed': 2.3603439331054688e-05}
</system-out></testcase></testsuite>
and in this case you’ll find out that the key metric load_time
was 1.11 seconds and the live_search_time was 1.09 seconds as
you can see here:
<properties>
    <property name="load_time" value="1.1175920963287354"/>
    <property name="live_search_time" value="1.0871295928955078"/>
</properties>
So thanks to JUnit XML reporting you can track response times (not only browser based timings) using a machine readable format to be ingested by third party systems with an acceptable approximation if you cannot track timings directly on the systems under test.
Track any property in JUnit XML reports using expressions
Let’s see a test_categories.yml (play_selenium required):
test_data:
  - category: dev
  - category: movie
  - category: food
---
- type: GET
  provider: play_requests
  url: https://api.chucknorris.io/jokes/categories
  expression: "'$category' in response.json()"
- provider: metrics
  type: record_property
  name: categories_time
  expression: "variables['_elapsed']*1000"
- type: assert
  provider: python
  expression: "variables['categories_time'] < 2500"
  comment: you can make an assertion against the categories_time
generates some custom properties (categories_time in milliseconds using a python expression)
using the --junit-xml results.xml cli option:
<?xml version="1.0" encoding="utf-8"?><testsuite errors="0" failures="0" name="pytest" skipped="0" tests="3" time="2.312"><testcase classname="test_categories.yml" file="test_categories.yml" name="test_categories.yml0" time="1.034"><properties><property name="categories_time" value="610.3124618530273"/></properties><system-out>{'expression': "'dev' in response.json()", 'provider': 'play_requests', 'type': 'GET', 'url': 'https://api.chucknorris.io/jokes/categories', '_elapsed': 0.6103124618530273}
{'expression': "variables['_elapsed']*1000", 'provider': 'python', 'type': 'exec', '_elapsed': 0.0006859302520751953}
{'expression': "variables['_elapsed']*1000", 'name': 'categories_time', 'provider': 'metrics', 'type': 'record_property', '_elapsed': 0.006484270095825195}
{'comment': 'you can make an assertion against the categories_time', 'expression': "variables['categories_time'] < 2500", 'provider': 'python', 'type': 'assert', '_elapsed': 0.0005526542663574219}
</system-out></testcase><testcase classname="test_categories.yml" file="test_categories.yml" name="test_categories.yml1" time="0.550"><properties><property name="categories_time" value="443.72105598449707"/></properties><system-out>{'expression': "'movie' in response.json()", 'provider': 'play_requests', 'type': 'GET', 'url': 'https://api.chucknorris.io/jokes/categories', '_elapsed': 0.44372105598449707}
{'expression': "variables['_elapsed']*1000", 'provider': 'python', 'type': 'exec', '_elapsed': 0.0009415149688720703}
{'expression': "variables['_elapsed']*1000", 'name': 'categories_time', 'provider': 'metrics', 'type': 'record_property', '_elapsed': 0.01613616943359375}
{'comment': 'you can make an assertion against the categories_time', 'expression': "variables['categories_time'] < 2500", 'provider': 'python', 'type': 'assert', '_elapsed': 0.0011241436004638672}
</system-out></testcase><testcase classname="test_categories.yml" file="test_categories.yml" name="test_categories.yml2" time="0.676"><properties><property name="categories_time" value="576.5485763549805"/></properties><system-out>{'expression': "'food' in response.json()", 'provider': 'play_requests', 'type': 'GET', 'url': 'https://api.chucknorris.io/jokes/categories', '_elapsed': 0.5765485763549805}
{'expression': "variables['_elapsed']*1000", 'provider': 'python', 'type': 'exec', '_elapsed': 0.0006375312805175781}
{'expression': "variables['_elapsed']*1000", 'name': 'categories_time', 'provider': 'metrics', 'type': 'record_property', '_elapsed': 0.006584644317626953}
{'comment': 'you can make an assertion against the categories_time', 'expression': "variables['categories_time'] < 2500", 'provider': 'python', 'type': 'assert', '_elapsed': 0.0005452632904052734}
</system-out></testcase></testsuite>
obtaining the metrics you want to track for each execution, for example:
<properties><property name="categories_time" value="610.3124618530273"/></properties>
so you might track the category as well for each test execution or whatever you want.
Monitoring test metrics with statsd/graphite
If you like the measure everything approach you can track and monitor interesting custom test metrics from an end user perspective during normal test executions or heavy load/stress tests thanks to the statsd/graphite integration.
Measuring important key metrics is important for many reasons:
- compare performance between different versions under same conditions using past tracked stats for the same metric (no more say the system seems slower today)
- predict the system behaviour with many items on frontend (e.g., evaluate the browser dealing with thousands and thousands of items managed by an infinite scroll plugin)
- predict the system behaviour under load
You can install statsd/graphite in minutes using Docker:
Basically you can track on statsd/graphite every numeric metric using
the same commands used for tracking metrics on JUnit XML reports as we will see.
In addition, but not required, installing the third party plugin called pytest-statsd.
you can track on statsd/graphite:
- execution times
- number of executed tests per status (pass, fail, error, etc)
Prerequisites (you need to install the optional statsd client not installed by default)::
pip install pytest-play[statsd]
Usage (cli options compatible with pytest-statsd):
--stats-d [--stats-prefix play --stats-host http://myserver.com --stats-port 3000]
where:
--stats-d, enablestatsd--stats-prefix(optional), if you plan on having multiple projects sending results to the same server. For example if you provideplayas prefix you’ll get a time metric under thestats.timers.play.YOURMETRIC.meankey (or instead of.meanyou can use.upper,upper_90, etc)--stats-host, by defaultlocalhost--stats-port, by default8125
Now you can track timing metrics using the record_elapsed or
record_elapsed_start/record_elapsed_stop commands seen before (pytest-play will
send for you time values to statsd converted to milliseconds as requested by statsd).
If you want to track custom metrics using the record_property command you have to provide
an additional parameter called metric_type. For example:
- provider: metrics
  type: record_property
  name: categories_time
  expression: "variables['_elapsed']*1000"
  metric_type: timing
- provider: metrics
  type: record_property
  name: fridge_temperature
  expression: "4"
  metric_type: gauge
Some additional information regarding the record_property command:
- if you don’t provide the
metric_typeoption inrecord_propertycommands values will not be transmitted tostatsd(eventually they will be tracked on JUnit XML report if--junit-xmloption was provided) - if you provide an allowed
metric_typevalue (timingorgauge) non numeric values will be considered as an error (ValueErrorexception raised) - non allowed
metric_typevalues will be considered as an error - if you provide
timingasmetric_type, it’s up to you providing a numeric value expressed inmilliseconds
Monitor HTTP response times
Monitor API response time (see https://github.com/pytest-dev/pytest-play/tree/features/examples/statsd_graphite_monitoring):
Browser metrics
Monitor browser metrics using Selenium from an end user perspective (see https://github.com/pytest-dev/pytest-play/tree/features/examples/statsd_graphite_monitoring_selenium):
- from page load to page usable
- live search responsiveness
Record metrics programmatically
If you don’t want to use pytest-play but you need to record test metrics
you can use pytest-play as a library::
def test_programmatically(play):
    play.execute_command({
        'provider': 'metrics',
        'type': 'record_property',
        'name': 'oil_temperature',
        'expression': '60',
        'metric_type': 'gauge'})
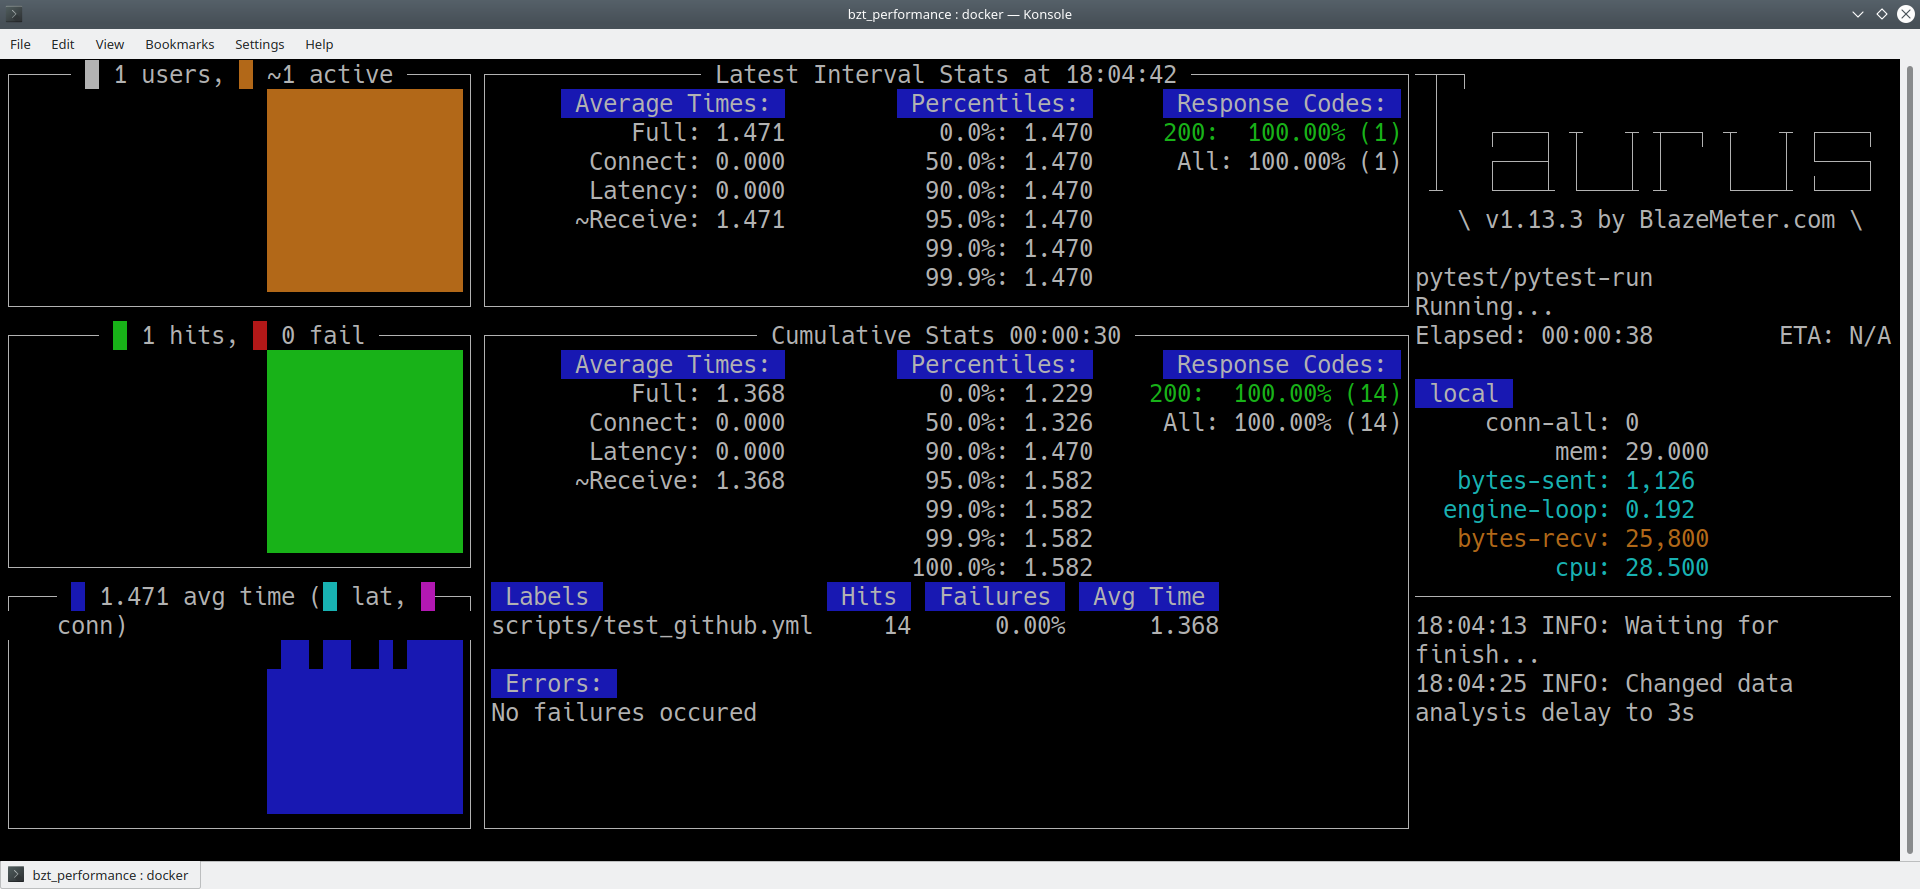
Performance tests with pytest-play and bzt/Taurus (BlazeMeter)
You can reuse all your pytest-play scenario and turn them to performance tests using bzt/Taurus (so it is compatible with BlazeMeter too and all its goodies).
Add a bzt/Taurus YAML file with no test_ prefix like that (full example here in
bzt_performance):
settings:
  artifacts-dir: /tmp/%Y-%m-%d_%H-%M-%S.%f

execution:
- executor: pytest
  scenario: pytest-run
  iterations: 1

scenarios:
  pytest-run:
    # additional-args: --stats-d --stats-prefix play
    script: scripts/

services:
- module: shellexec
  prepare:
  - pip3 install -r https://raw.githubusercontent.com/davidemoro/pytest-play-docker/master/requirements.txt
and run the following command:
docker run --rm -it -v $(pwd):/src --user root --entrypoint "bzt" davidemoro/pytest-play bzt.yml
You will see bzt up and running playing our scenarios:
You can uncomment additional-args to pass other pytest command line options (e.g., enable statsd
for key user metrics monitoring or any other cli option).
More info about bzt/Taurus here:
Dynamic expressions in payloads without declaring variables
If you have to send a certain payload to a REST endpoint or a MQTT message
containing a dynamic value you can store a variable with store_variable
and use $variable_name in your payload when needed.
Storing variables is cool if you will reuse later that value but if just have to
generate a dynamic value, let’s say a timestamp in milliseconds,
you can use the {! EXPRESSION !} format.
For example (play_mqtt plugin required):
---
- comment: python expressions in mqtt payload (without declaring variables)
  provider: mqtt
  type: publish
  host: "$mqtt_host"
  port: "$mqtt_port"
  endpoint: "$mqtt_endpoint/$device_serial_number"
  payload: '{
        "measure_id":   [124],
        "obj_id_L":     [0],
        "measureType":  ["float"],
        "start_time":   {! int(datetime.datetime.utcnow().timestamp()*1000) !},
        "bin_value":    [1]
    }'
where instead of the expression:
{! int(datetime.datetime.utcnow().timestamp()*1000) !},
will be printed:
1553007973702
Browser based commands
The pytest-play core no more includes browser based commands. Moved to play_selenium
external plugin.
pytest-play is pluggable and extensible
pytest-play has a pluggable architecture and you can extend it.
For example you might want to support your own commands, support non UI commands like making raw POST/GET/etc calls, simulate IoT devices activities, provide easy interaction with complex UI widgets like calendar widgets, send commands to a device using the serial port implementing a binary protocol and so on.
How to register a new command provider
Let’s suppose you want to extend pytest-play with the following command:
command = {'type': 'print', 'provider': 'newprovider', 'message': 'Hello, World!'}
You just have to implement a command provider:
from pytest_play.providers import BaseProvider

class NewProvider(BaseProvider):

    def this_is_not_a_command(self):
        """ Commands should be command_ prefixed """

    def command_print(self, command):
        print(command['message'])

    def command_yetAnotherCommand(self, command):
        print(command)
and register your new provider in your setup.py adding an entrypoint:
entry_points={
    'playcommands': [
        'print = your_package.providers:NewProvider',
    ],
},
You can define new providers also for non UI commands. For example publish MQTT messages simulating IoT device activities for integration tests.
If you want you can generate a new command provider thanks to:
Metadata format
You can also add some scenario metadata placing another YAML document on top of the scenario
defined on the test_XXX.yml with the following format:
---
markers:
  - marker1
  - marker2
test_data:
  - username: foo
  - username: bar
---
# omitted scenario steps in this example...
Option details:
markers, you can decorate your scenario with one or more markers. You can use them in pytest command line for filtering scenarios to be executed thanks to marker expressions like-m "marker1 and not slow"test_data, enables parametrization of your decoupletd test data and let you execute the same scenario many times. For example the example above will be executed twice (one time with “foo” username and another time with “bar”)
New options will be added in the next feature (e.g., skip scenarios, xfail, xpass, etc).
Examples
Articles and talks
Articles:
- Hello pytest-play!
- API/REST testing like Chuck Norris with pytest play using YAML
- pytest-play automated docker hub publishing workflow
- Test automation framework thoughts and examples with Python, pytest and Jenkins
- Testing metrics thoughts and examples: how to turn lights on and off through MQTT with pytest-play
Talks:
Third party pytest-play plugins
play_selenium,
pytest-playplugin driving browsers using Selenium/Splinter under the hood. Selenium grid compatible and implicit auto wait actions for more robust scenarios with less controls.play_requests,
pytest-playplugin driving the famous Pythonrequestslibrary for makingHTTPcalls.play_sql,
pytest-playsupport for SQL expressions and assertionsplay_cassandra,
pytest-playsupport for Cassandra expressions and assertionsplay_dynamodb,
pytest-playsupport for AWS DynamoDB queries and assertionsplay_websocket,
pytest-playsupport for websocketsplay_mqtt,
pytest-playplugin for MQTT support. Thanks toplay_mqttyou can test the integration between a mocked IoT device that sends commands on MQTT and a reactive web application with UI checks.You can also build a simulator that generates messages for you.
Feel free to add your own public plugins with a pull request!
Welcome to pytest-play’s documentation!
Contents:
- CHANGES
- 2.3.1 (unreleased)
- 2.3.0 (2019-04-05)
- 2.2.2 (2019-03-29)
- 2.2.1 (2019-03-19)
- 2.2.0 (2019-03-01)
- 2.1.0 (2019-02-22)
- 2.0.2 (2019-02-06)
- 2.0.1 (2019-01-30)
- 2.0.0 (2019-01-25)
- 1.4.2 (2018-05-17)
- 1.4.1 (2018-04-06)
- 1.4.0 (2018-04-05)
- 1.3.2 (2018-02-05)
- 1.3.1 (2018-01-31)
- 1.3.0 (2018-01-22)
- 1.2.0 (2018-01-22)
- 1.1.0 (2018-01-16)
- 1.0.0 (2018-01-10)
- 0.3.1 (2018-01-04)
- 0.3.0 (2018-01-04)
- 0.2.0 (2018-01-02)
- 0.1.0 (2017-12-22)
- 0.0.1 (2017-12-20)
- API